Implementation Plan (1987)
Planning Agency: International Highway Construction Agency
Implementing Agency: Far East Development Co., Ltd.
Seafloor geological survey area 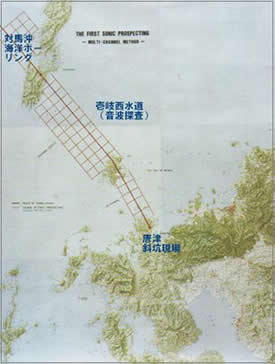 along the Japan-Korea tunnel route
This survey included a single-channel sonar survey using sparkers and a side-scan sonar survey of the seafloor topography and geological features. The most promising route for a Japan-Korea tunnel would be from the Higashimatsuura Peninsula in Saga Prefecture, passing through Iki Island, south of Tsushima Island (Shimoshima), and then from there, near Gozaki on the west side, to Geoje Island on the Korean side.
Submarine topography and geological surveys of the offshore area along this route have included multi-channel sonar surveys using sparkers in 1983, single-channel sonar surveys and bathymetric surveys using sparkers, multi-channel sonar surveys using water guns, dredging tools, and marine drilling, resulting in the compilation of numerous submarine topography and geological maps. This time, a submarine topography and geological survey of the area north of the Tsushima West Channel will be conducted, providing basic information for route selection.
① Survey of seabed topography using acoustic sounding
② Survey of seabed geology and geological structure using sparker single-channel sonic exploration
③ Survey of seabed topography and bottom sediment using side-scan sonar imaging equipment
④ Measurement of tide levels using tidal gauges
① Acoustic sounding: 1,160km
② Sparker single channel sonic survey: 810km
③ Side scan sonic imaging: 350km
④ Tidal measurements: Measured every 10 minutes during operation
The survey period was from May 1 to July 31, 1987.
1. Ship position measurement
is performed using the two-distance intersection method with a radio wave positioning device (Trisponder). A known reference point is used as the slave station. Four slave stations are used, with the two most suitable for ship position measurement being selected at any time so that the intersection angle of the two distances falls within the range of 30° to 150°. Data is output to a printer and input to magnetic tape using an X-Y converter.
The virtual origin of the exchange coordinate system used in this study to streamline the work is
set to the primary system: X=152490.0 Y=-12191.3 θ=320.0°.
*Sonic exploration using sparkers as the sound source
2.
Continuous depth measurements are taken using an echo sounder (PDR-101 type). A fixed line is placed every two minutes to check the correspondence with the wake.
Bar checks are done once a day or whenever the recording paper or pen is replaced. Depth is measured twice, "down" and "up," every 5m up to 50m.
For depths of 50m or deeper, calculations are made from a correction curve obtained from data such as seawater temperature, pressure, and salinity. Draft adjustments are made according to changes in the draft.
3. Sonic survey:
A single-channel sonic survey will be conducted using a sparker as the sound source. The energy source used in this survey can range from 200 to 8,000 joules. Prior to the survey, test runs will be conducted to determine the ship speed, magnitude of seismic energy, towing length, depth, filter bandwidth, etc. of the spark array and hydrohorn to determine the initial conditions suitable for the survey.
4. Acoustic imaging:
A site scan sonar is used to conduct an acoustic imaging survey of the seabed. 100KHz/500KHz acoustic waves are emitted in a fan shape onto the seabed from the inside of a towed vessel (two fish) towed from the stern. The waves reflected from the seabed are received and converted into electrical signals, which are then corrected for slope distance, amplitude, and ship speed before being output to a recording paper. The data is also recorded.
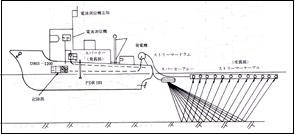
*Outline of the research vessel's equipment
5.
During the tidal observation survey, tidal observation records from Sasuna, Kamiagata Town, Tsushima will be used.
If the survey is conducted in a location without a tidal observation station, a suitable observation location will be selected and tidal height will be observed every 10 minutes to the nearest 1 cm using a direct scale. Leveling will be carried out at the hydrographic basic level marker and the observation location, and the basic level surface will be calculated. This will be used as the water depth correction value for the acoustic sounding.
6. Deliverables
Survey report (summary)
construction survey of the Japan-Korea tunnel
construction survey of the Japan-Korea tunnel
Overview of the Japan-Korea Tunnel
![]()